Interim Reanalysis Validation (last 2 years)
Last validation statistics update:
Surface Chlorophyll
MedBFM interim reanalysis versus (minus) CMEMS multi satellite REP observations. Statistics of bias and root mean square difference (RMS) are computed daily for the monthly of interim timeseries and compared with the Estimated Accuracy Number (EAN; QuiD).
BGC-Argo float: skill metrics
Statistics of bias and root mean square difference (rmse) are computed weekly for the interim reanalysis in selected large sub-basins and layers. Number of available floats in grey.
Time evolution of BGC-Argo float -
Hovmoller diagrams of chlorophyll concentration (mg/m3) from float data (2nd row) and model outputs (3rd row) matched-up with float position (1st row) in the previous 24 months. From 4th to 7th rows, computation of selected skill indexes for model (solid line) and float data (dots). The skill indexes are respectively: surface (SURF) and 0‑200 m vertically averaged (INTG) chlorophyll, correlation (CORR), depth of the deep chlorophyll maximum (DCM, blue) and depth of the mixed layer bloom in winter (MWB, red). Trajectory of the BGC‑Argo floats is reported in the upper panel, with deployment position (blue cross).
Hovmoller diagrams of nitrate concentration (mmol/m3) from float data (2nd row) and model outputs (3rd row) matched-up with float position (1st row) in the previous 24 months. From 4th to 7th rows, computation of selected skill indexes for model (solid line) and float data (dots). The skill indexes are respectively: nitrate concentration at surface (SURF) and 0‑200 m vertically averaged concentration (INTG), correlation between profiles (CORR), depth of the nitracline computed as NITRCL1 and NITRCL2. Trajectory of the BGC‑Argo floats is reported in the upper panel, with deployment position (blue cross).
Hovmoller diagrams of oxygen concentration from float data (2nd row) and model outputs (3rd row) matched-up with float position (1st row) for the interim reanalysis. From 4th to 7th rows, computation of selected skill indexes for model (solid line) and float data (dots). The skill indexes are respectively: oxygen concentration at surface (SURF) and oxygen at saturation, 0‑200 m vertically averaged concentration (INTG), correlation between profiles (CORR), depth of oxygen minimum zone (between 200‑1000 m) and depth of maximum “surface” oxygen (between 0‑200 m). BGC‑Argo floats is reported in the upper panel, with deployment position (blue cross).
Hovmoller diagrams of phytoplankton biomass (mgC/m3) from float data (2nd row) and model outputs (3rd row) matched-up with float position (1st row) in the previous 24 months. From 4th to 6th rows, computation of selected skill indexes for model (solid line) and float data (dots). The skill indexes are respectively: surface (SURF) and 0‑200 m vertically averaged (INTG 0-200) phytoplankton biomass, and correlation (CORR). Trajectory of the BGC‑Argo floats is reported in the upper panel, with deployment position (blue cross).
Timeseries
Time series of last years of the interim renalysis superimposed to the 1999-2019 reanalysis timeseries.
The skill performance page of the interim reanalysis (from year 2020) aims at delivering sustained on-line information of the quality of biogeochemical forecast products (i.e. to identify main biases and suspicious trends in the time series, and to establish accuracy values for simulated variables).
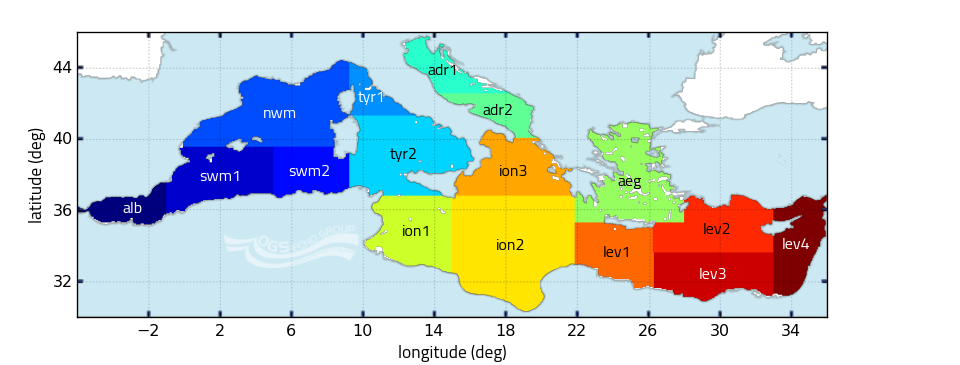
Statistics are computed over the following subdivision of the Mediterranean Sea

Additional detail about CMEMS validation activities at the following link
Near Real Time on line validation of physical variables at the following link
